- The proportion of savers (who hold their money in bank accounts) relative to investors (who invest in equities and bonds) is higher in Europe than in the US.
- By moving from saving to investing, European savers can boost their long-term wealth.
- By taking the further step of becoming cost-conscious investors, they can achieve even better financial outcomes.
European citizens can “greatly benefit” from investing in capital markets “as they can get a higher return from their savings and contribute to job creation and growth,” according to the European Commission’s new Savings and Investments Union (SIU) initiative.
The SIU has been created to improve the way the European Union (EU) financial system channels savings to productive investment, creating more and a wider range of financial opportunities for people and businesses.
However, the share of investors—relative to savers—is lower in Europe than it is in the United States (US). Savers tend to hold their assets in bank accounts, while investors generally put their money into equity and bond markets. According to recent figures from the OECD1 and Eurostat, EU households hold 38% of their financial assets in “equities, investment funds, and/or debt securities”, compared with 58% of US households2.
Vanguard advocates for disciplined participation in global investment markets, which can improve an individual’s chances of achieving their long-term financial goals. Having too much money in savings has consequences for household wealth – investing, by contrast, can offer better long-term growth potential. Our research shows the true value of low-cost investing in the capital markets.
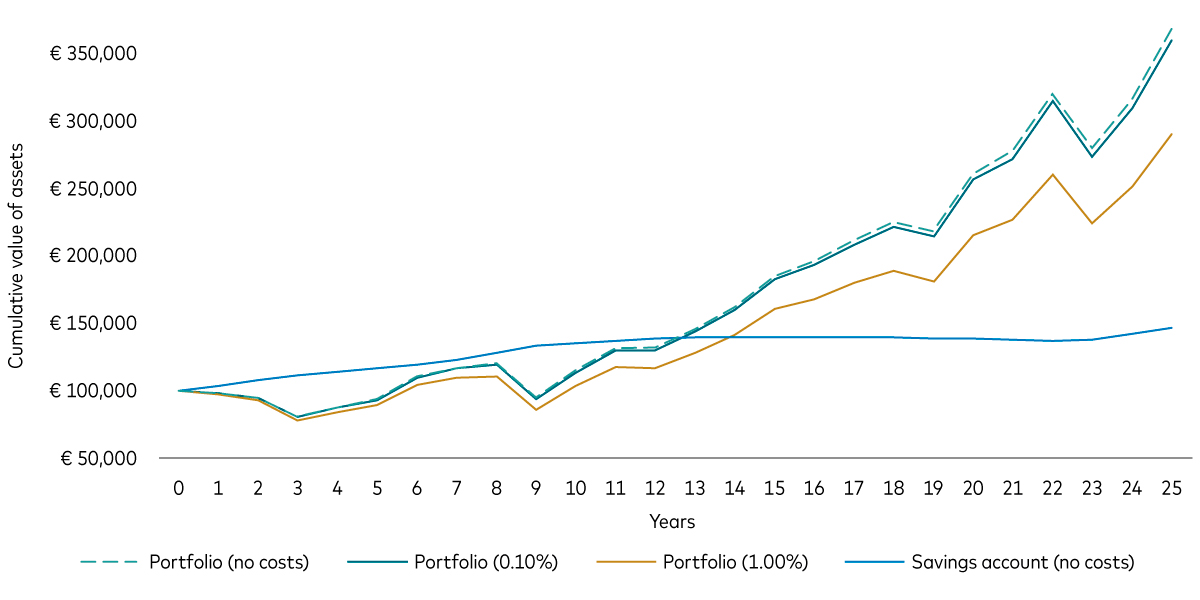
The chart below compares the hypothetical growth of €100,000 held in a savings account with the same amount invested in a diversified portfolio of global equities and bonds over a 25-year period. The value of the savings account would have reached less than €150,000, while the investment portfolio would have grown to nearly €370,0003.
The chart also shows the importance of costs to your overall wealth. The investment portfolio with costs of 1% per annum would have grown to around €290,000 over the 25-year period. While investing in this portfolio would result in higher wealth than putting the money in a savings account, the investor’s money would have grown more in a lower-cost portfolio. An investor who chose an identical investment portfolio but with a cost of 0.10% per annum would have seen their wealth grow to approximately €360,000. While an annual cost difference of 0.90% may seem insignificant, these costs compound over time, meaning the low-cost investor would have around €70,000 more in their portfolio at the end of the period than the high-cost investor.
Investing increases long-term wealth - but costs reduce the growth

Notes: The portfolio balances shown are hypothetical and do not reflect any particular investment. The rate of return is not guaranteed. The final account balances do not reflect any taxes or penalties that might be due upon distribution. The chart displays the cumulative value of €100,000 held in either a 60% global equity and 40% global bond portfolio or in a savings account that earned the return of the 3-month Euribor. We simulated the portfolio values by using annual returns of the 60/40 equity and bond portfolio over a 25-year period ending 31 December 2024. Global equity returns were proxied by the MSCI AWCI Gross Total Return Index in EUR and global bond returns were proxied by the Bloomberg Global Aggregate Bond Index Total Return in EUR. The 60/40 asset allocation was rebalanced annually. We reduce the annual return of each investment portfolio by the fee rate specified in brackets. The savings account earns the annual return of the 3-month Euribor rate without any costs. Time period is from 1 January 2000 to 31 December 2024.
Source: Vanguard calculations, using data from Bloomberg.
Despite the negative impact of costs, many investors still choose relatively high-cost investment products. Why? Often, it’s because they hold the belief that higher costs signal greater quality—for example, that higher-cost funds might employ more skilful managers, who in turn generate greater after-cost returns.
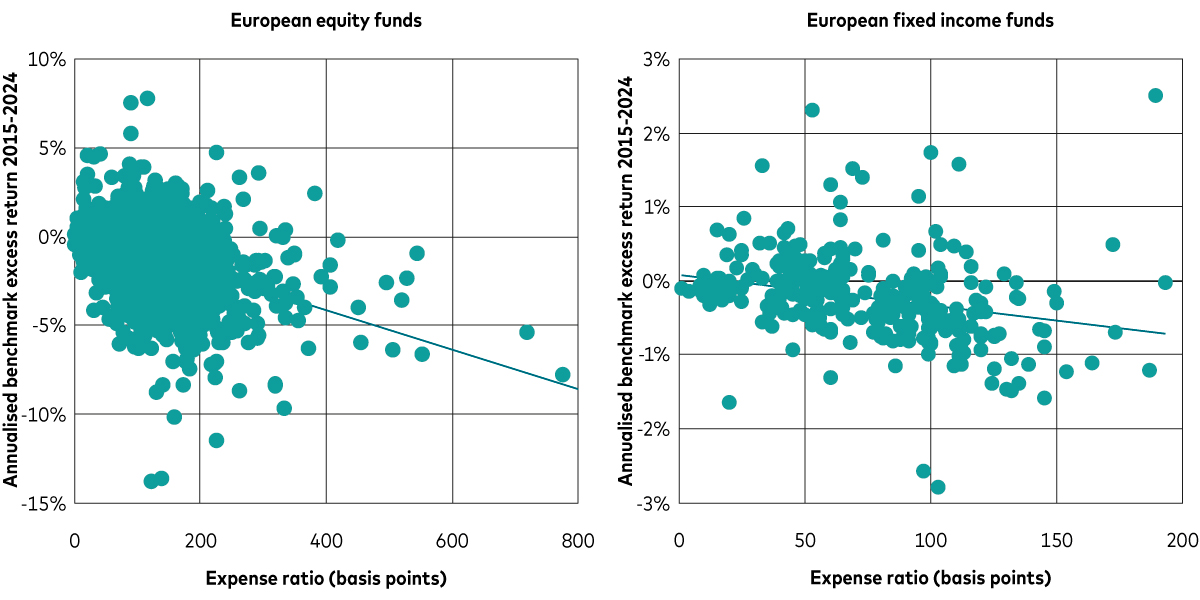
Vanguard found the opposite to be true when we looked at the after-cost returns of European equity and bond funds in excess of an appropriate benchmark (one that fairly represents the investment characteristics and risk exposures of the fund) relative to expense ratios.
The following charts show the negative relationship between expenses and after-cost performance. While results may differ when looking at before-cost performance, both charts exhibit a downward-sloping pattern, illustrating that as expenses increase, excess returns tend to decrease. Admittedly, there is some variability. However, we find costs to be a drag on the performance of the average active fund. Simply put, costs matter.
Higher costs are associated with lower excess returns

Notes: The chart displays the distribution of fund-level annual report net expense ratios in basis points and net excess returns in percent relative to the fund’s prospectus benchmark for the oldest share class of active and index equity and fixed income UCITS funds available for sale in Europe over the period 1 January 2015 to 31 December 2024. The trend line is the result of an asset-weighted regression of fund excess returns on annual report net expense ratios using 31 December 2014 fund assets to weight observations. The x-axis and y-axis of each chart are truncated to remove the impact of outliers. Returns are in EUR. One basis point equals 1/100 of a percentage point.
Source: Vanguard calculations, using data from Morningstar.
Moving from being a saver to investor increases the likelihood of generating greater long-term wealth. However, costs matter. Helping people move from being a saver to a low-cost investor can make them even better off over the long-term than a less cost-discerning investor.
Keeping costs low has been one of Vanguard’s guiding principles for investment success since we opened for business in 1975. We strive to offer low-cost solutions in every market we enter, because history shows that low-cost investments tend to outperform higher-cost peers over the long term.
1 The Organisation for Economic Co-operation and Development.
2 Source: OECD and Eurostat 2023 data collected from respective web-hosted databases.
3 Source: Vanguard. Simulations of the investment portfolios are based on estimated annual returns that a EUR-denominated investor would receive over a 25-year investment period ending in December 2024, based on a 60% global equity and 40% global bond portfolio. Our simulation of the savings account is based on the annual return of the 3-month Euribor over the same time-period.
Investment risk information
The value of investments, and the income from them, may fall or rise and investors may get back less than they invested.
Past performance is not a reliable indicator of future results. The performance data does not take account of the commissions and costs incurred in the issue and redemption of shares.
Important information
For professional investors only (as defined under the MiFID II Directive) investing for their own account (including management companies (fund of funds) and professional clients investing on behalf of their discretionary clients). In Switzerland for professional investors only. Not to be distributed to the public.
The information contained herein is not to be regarded as an offer to buy or sell or the solicitation of any offer to buy or sell securities in any jurisdiction where such an offer or solicitation is against the law, or to anyone to whom it is unlawful to make such an offer or solicitation, or if the person making the offer or solicitation is not qualified to do so. The information does not constitute legal, tax, or investment advice. You must not, therefore, rely on it when making any investment decisions.
The information contained herein is for educational purposes only and is not a recommendation or solicitation to buy or sell investments.
Issued in EEA by Vanguard Group (Ireland) Limited which is regulated in Ireland by the Central Bank of Ireland.
Issued in Switzerland by Vanguard Investments Switzerland GmbH.
Issued by Vanguard Asset Management, Limited which is authorised and regulated in the UK by the Financial Conduct Authority.
© 2025 Vanguard Group (Ireland) Limited. All rights reserved.
© 2025 Vanguard Investments Switzerland GmbH. All rights reserved.
© 2025 Vanguard Asset Management, Limited. All rights reserved.
